Social Vulnerability, COVID-19 and Climate

As communities worldwide respond to the COVID-19 crisis, the Urban Systems Lab team stands in solidarity with frontline responders, those most affected, and communities working to help those most in need.
With our resilience tested, the USL will be providing resources and new analysis on potential impacts of COVID-19 on vulnerable communities in NYC, and the interdependent risks of COVID-19 and climate. We will update this page regularly including key research, datasets, and relevant articles that may be important to stay informed of during this ongoing crisis. We hope this will provide a useful resource to visualize how to understand multiple dimensions of how COVID-19 may impact communities and so that we can share strategies, actions, and nurture hope in a time of uncertainty.
COVID-19 Research Blog Articles
COVID-19 RESEARCH PAPERS
Pandemic Injustice: Spatial and Social Distributions of the first wave of COVID-19 in the US Epicenter Link
Parks are Critical Urban Infrastructure: Perception and Use of Urban Green Spaces in NYC During COVID-19 Link
Who has nature during the pandemic? COVID-19 cases track widespread inequity in nature access across the United States Link
A climate resilience research renewal agenda: learning lessons from the COVID-19 pandemic for urban climate resilience Link
Nature inequity and higher COVID-19 case rates in less-green neighbourhoods in the United States Link
Who benefits from urban green spaces during times of crisis? Perception and use of urban green spaces in New York City during the COVID-19 pandemic Link
COVID-19 Blog

OcTober 11, 2021
New Analysis Links COVID-19 to Nature Inequity, Showing Communities of Color Face Starkest Burden
Researchers at the San Francisco Estuary Institute, The Nature Conservancy, and the Urban Systems Lab, publish a new study in the journal Nature Sustainability showing communities of color have both higher burdens of Covid-19 and less green vegetation, and trees in their neighborhoods across all urbanized areas in the United States. Most surprisingly, the study found that even after statistically controlling for race, income, and a host of other factors, more greenness is associated with lower Covid-19 rates. This is one the first national studies that makes this relationship crystal clear.
May 14, 2021
Rapid Research and Assessment on COVID-19 and Climate in New York City
New article is available in the Journal of Extreme Events highlighting the USL’s work with NYC City Agencies and Departmental leaders on rapid response to the impacts of COVID-19 in NYC. The article details the New York City (NYC) Mayor’s Office of Climate Resiliency (MOCR) bi-weekly discussions, called the Rapid Research and Assessment (RRA) Series, between City staff and external experts in science, policy, design, engineering, communications, and planning. The goal was to rapidly develop authoritative, actionable information to help integrate resiliency into the City’s COVID response efforts. Read the full article here.
March 11, 2021
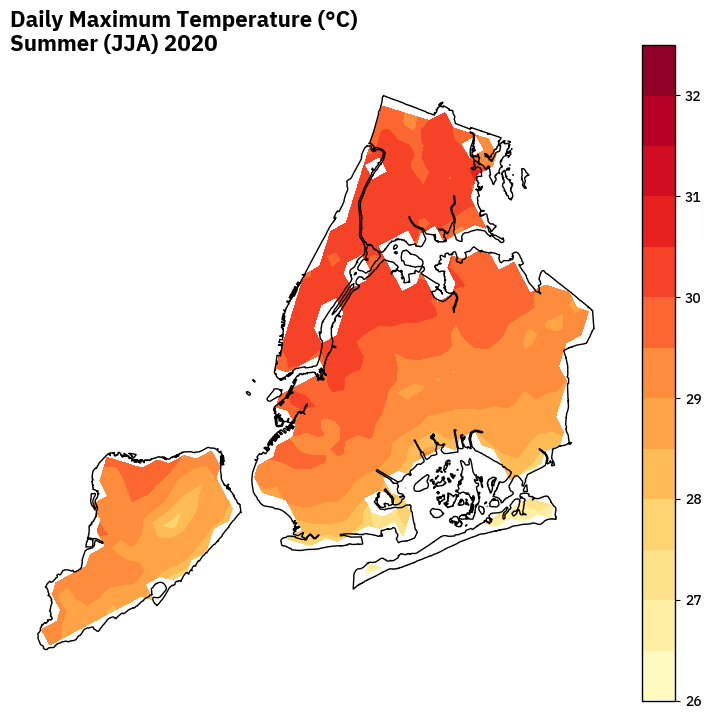
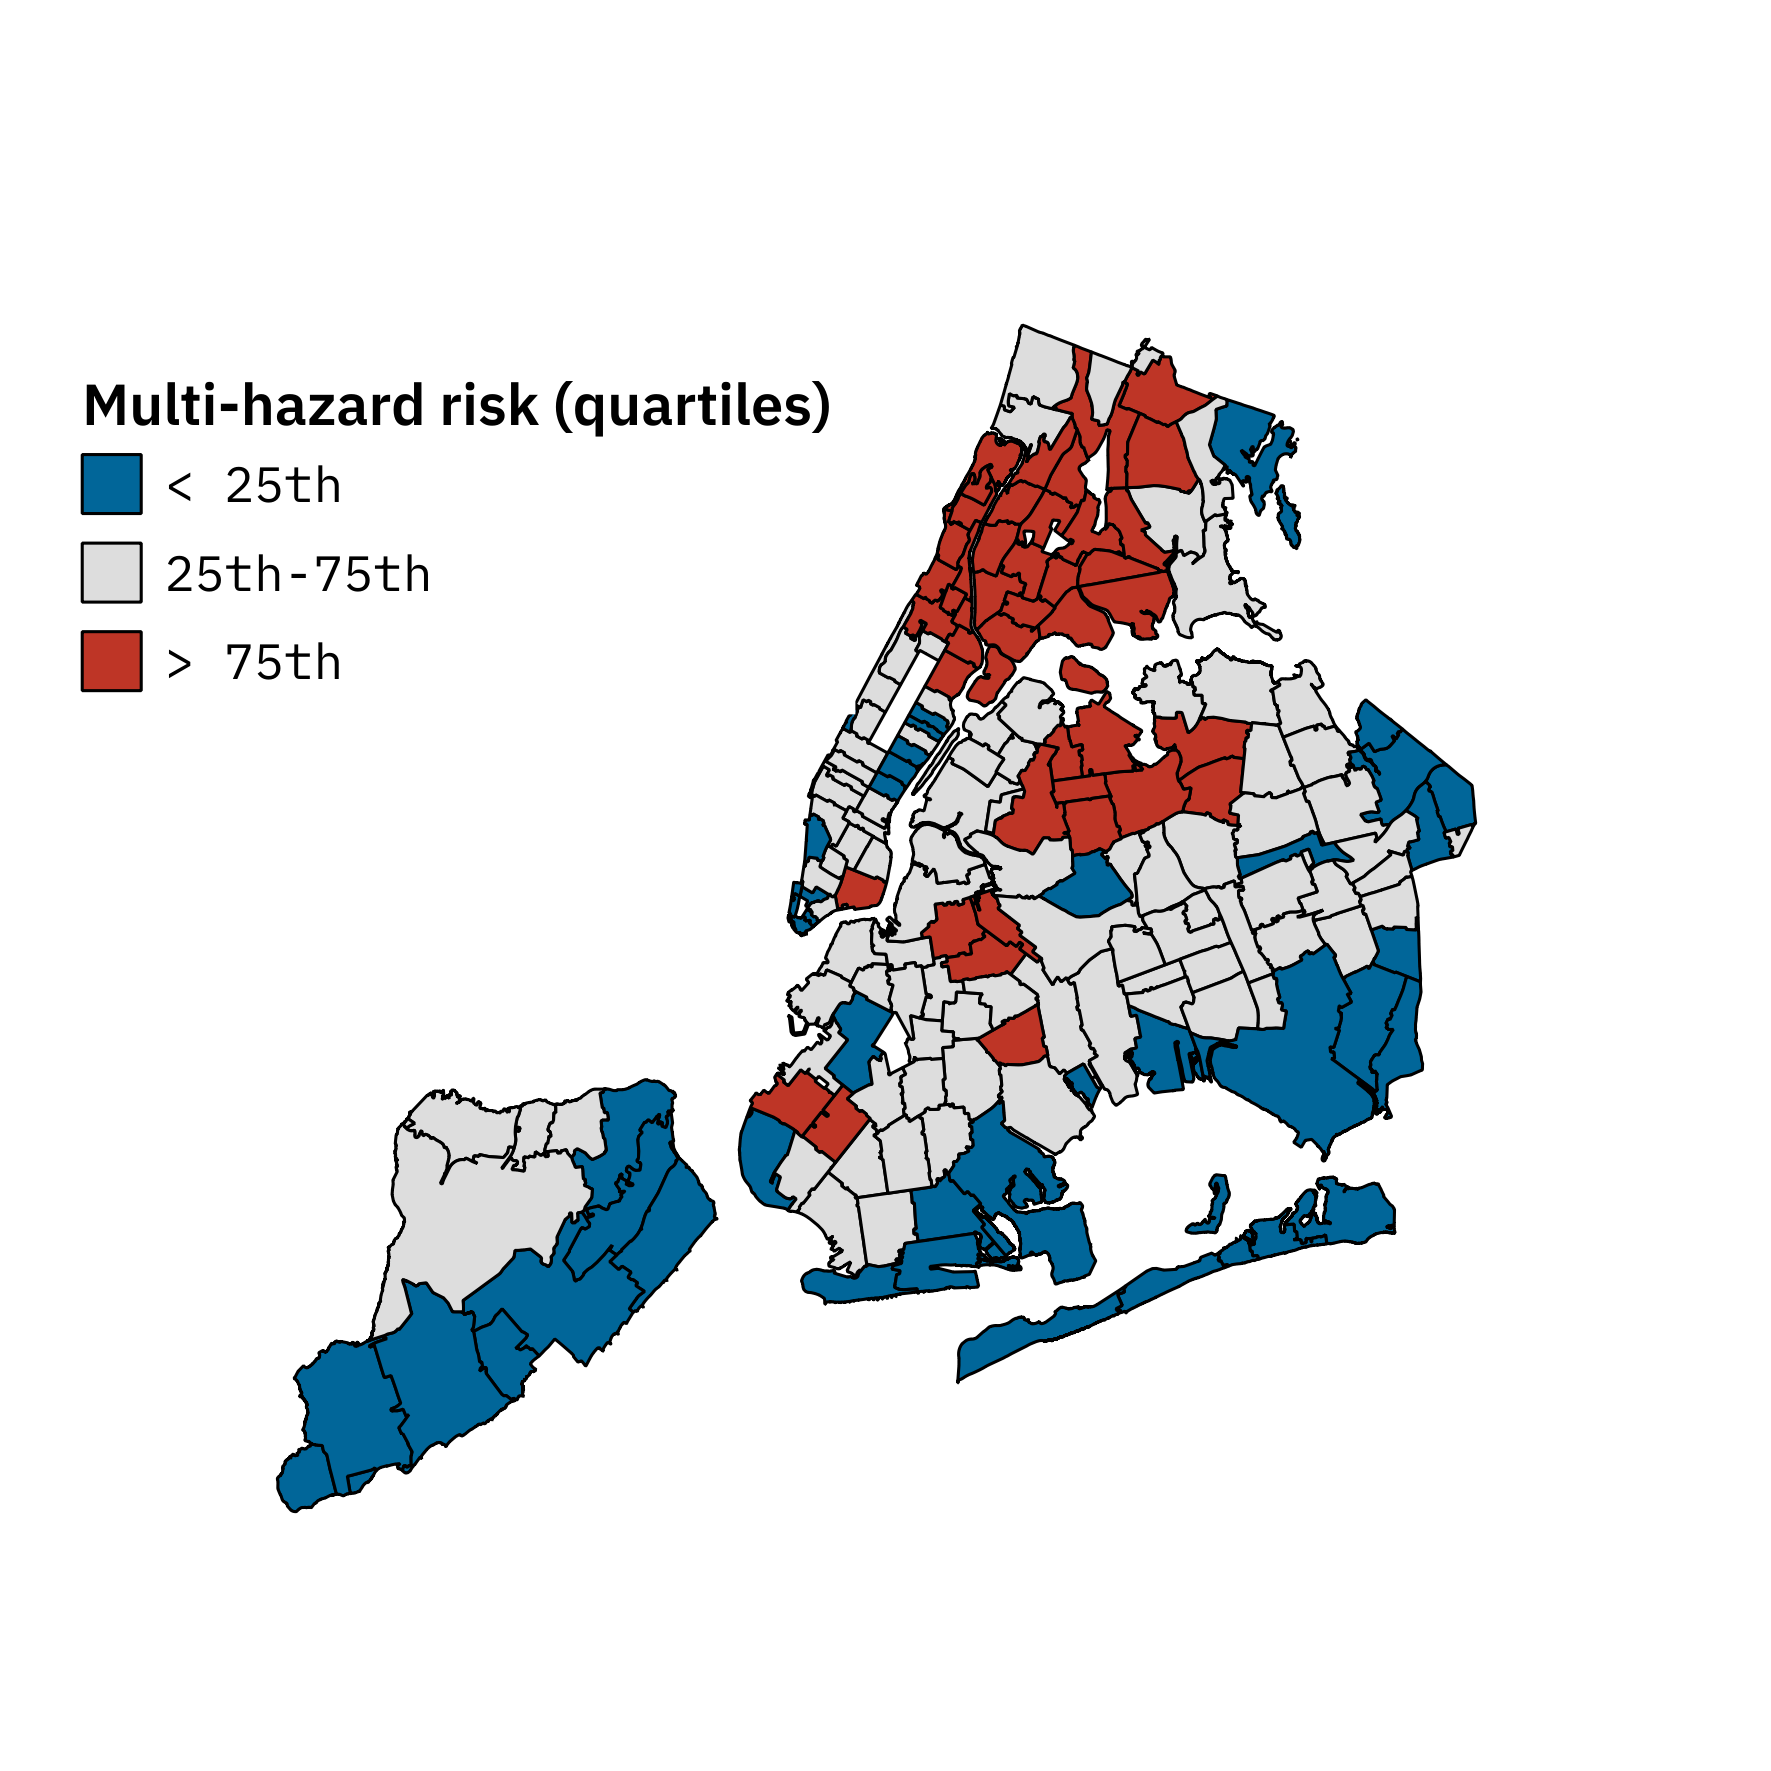
Modeling and Visualizing Multi-Hazard Risk: Heat Vulnerability and COVID-19 in NYC
Hazards don't always occur in isolation, and there can be significant spatial overlaps between who is exposed to them and who is least able to cope. Here we use a multi-hazard risk framework to map where the highest combined impacts of COVID-19 and extreme heat can occur in NYC.
In our analysis, we consider the average of the daily maximum temperatures in June-July-August and use COVID-19 case rates as an indicator of the virus hazard. Zip codes with high overlapping risk (upper 25th quartile) are shown red, with low risk areas in blue (lower 25th quartile). Maps developed by USL Postdoctoral Research Fellow, Luis Ortiz.
February 12, 2020
Who has nature during the pandemic?
The USL’s research on the impacts of COVID-19 in NYC, including ongoing spatial analysis of urban greenspace access is now included in a new pre-print article: “Who has nature during the pandemic? COVID-19 cases track widespread inequity in nature access across the United States”.
Abstract: Urban nature can alleviate distress and provide space for safe recreation during the COVID-19 pandemic. However, nature is often less available in low-income and communities of color—the same communities hardest hit by COVID-19. We quantified nature inequality across all urbanized areas in the US and linked nature access to COVID-19 case rates for ZIP Codes in 17 states. Areas with majority persons of color had both higher case rates and less greenness. Furthermore, when controlling for socio-demographic variables, an increase of 0.1 in Normalized Difference Vegetation Index (NDVI) was associated with a 4.1% decrease in COVID-19 incidence rates (95% confidence interval: 0.9-6.8%). Across the US, block groups with lower-income and majority persons of color are less green and have fewer parks. Thus, communities most impacted by COVID-19 also have the least nature nearby. Given urban nature is associated with both human health and biodiversity, these results have far-reaching implications both during and beyond the pandemic.
December 16, 2020
Sonification For Impact: Turning New York City COVID-19, Climate Data and Social Vulnerability Index Data into Sound
USL Faculty Fellow Debra Anderson McGrory worked with the USL’s Claudia Tomateo and Pablo Herreros Cantis on a research project exploring the application of data sonification to better understand COVID-19 data in NYC. Leveraging the NYC Health Department’s COVID-19 data, New York State COVID-19 Data Daily Counts of Cases, Hospitalizations and Deaths the Lab’s Social Vulnerability, COVID-19 and Climate research, the team developed a map-based data visualization to sonify the number of NYC cases, hospitalizations and deaths.
The team explored a variety of research questions in the process: What does the societal impact of Coronavirus COVID-19 sound like in urban environments? How might the technique of data sonification, the process of turning data into sound, provide a new sensory experience to better understand this data? What value does sonification add to a chart or graph? What can we learn from data by listening to it on its own or in tandem with a data visualization? Could a map of NYC have an accompanying soundtrack to communicate health disparities and structural inequities of the geographic spread of pandemic per zip code?
The above video demonstrates an animated, sonified geospatial data visualization of Coronavirus COVID-19 impact by neighborhood in New York City, sonifying two social impact variables. First, the percent of population below the poverty line and second, the percent of population infected with Coronavirus COVID-19. You will hear a sonic legend. The higher the percentage of positive COVID-19 cases, the higher the pitch. The higher percentage of people living below the poverty line, the higher the distortion. We have selected 10 zip codes in NYC to tell this story in sound. As we travel between each zip code you will hear the sounds of a quiet New York City in quarantine to represent our travel between each distance. Data sources include the New York Department of Health Coronavirus Disease COVID-19 Data by Zip Code and US Census Bureau American Community Survey Social Vulnerability Index data for percentage of people living below poverty.
The purpose of this video excerpt is to present methods for communicating data with both audio and visuals. Narration, text-to-speech, ambient sounds and data sonification are combined with dynamic map-based graphics and text to demonstrate the concept that an audiovisual rendering of data can be more impactful for a non-technical audience than a silent visualization. Read more about the project via Resilience Quarterly →
November 18, 2020
Pandemic Injustice: Spatial and Social Distributions of the first wave of COVID-19 in the US Epicenter
The USL team has published a pre-print article, Pandemic Injustice: Spatial and Social Distributions of the first wave of COVID-19 in the US Epicenter, now available to download. In the article, we examine the uneven social and spatial distributions of COVID-19 and their relationships with indicators of social vulnerability in the U.S. epicenter, New York City (NYC). As of July 17th, 2020, NYC, despite having only 2.5% of the US population, has ~6% of all confirmed cases, and ~16% of all deaths, making it a key learning ground for the social dynamics of the disease. Our analysis focuses on the multiple potential social, economic, and demographic drivers of disproportionate impacts in COVID-19 cases and deaths, as well as population rates of testing. Findings show that immediate impacts of COVID-19 largely fall along lines of race and class. Indicators of poverty, race, disability, language isolation, rent burden, unemployment, lack of health insurance, and housing crowding all significantly drive spatial patterns in prevalence of COVID-19 testing, confirmed cases, death rates, and severity. Income in particular has a consistent negative relationship with rates of death and disease severity. The largest differences in social vulnerability indicators are also driven by populations of people of color, poverty, housing crowding, and rates of disability. Results highlight the need for targeted responses to address injustice of COVID-19 cases and deaths, importance of recovery strategies that account for differential vulnerability, and provide an analytical approach for advancing research to examine potential similar injustice of COVID-19 in other U.S. cities.
October 6, 2020
Parks are Critical Urban Infrastructure: The Use of Urban Green Space in New York City During COVID-19
The USL published a new article in The Nature of Cities, “Parks are Critical Urban Infrastructure: The Use of Urban Green Space in New York City During COVID-19”. In one of the most comprehensive studies on the use of urban parks and open spaces in NYC during COVID-19, the USL team and partners at The Nature Conservancy in New York, Building Healthy Communities NYC and the New York State Health Foundation find perception of access is unequal across the five boroughs, and a reduction in funding may compromise ability of parks managers and officials to manage significant shifts in use. Read more →
August 25, 2020
New Article on Urban Green Space Use during COVID-19 in NYC
Figure. Variation in responses about the importance of parks and open space for mental (A,B) and physical (C,D) health across gender (A,C) and race/ethnicity (B,D) groups.

The USL research team, Bianca Lopez, Chris Kennedy and Timon McPhearson developed a new pre-print article, Parks are Critical Urban Infrastructure: Perception and Use of Urban Green Spaces in NYC During COVID-19, exploring the results of a social survey launched during the early months of the Covid-19 pandemic in NYC. Working with partners at Building Healthy Communities NYC, The New York State Health Foundation, and The Nature Conservancy, the study examines the impact of COVID-19 on the perception and use of urban green spaces in New York City. The results support anecdotal evidence of shifts in park use, and the real controversy of who can benefit from parks in NYC, historically, but also during COVID. Overall we found access to urban green spaces during COVID-19 is not equal despite being more important now for physical and mental health than before the pandemic. We also found key differences between the concerns and needs of different populations, with Black communities expressing additional concerns over policing and racial profiling, and indications that low income and communities of color do not have access to larger parks of quality, and thus reducing their use and perceived access. Read the pre-print to learn more.
July 27, 2020
Hydrant Hand Washing Retrofit Prototype
USL Faculty Fellow Chris Woebken is working on a small hand washing hydrant retrofit prototype developed with the hydrants working group in collaboration with Tei Carpenter, Beyond Plastics at Bennington College, RETI Center and Pioneer Works in Brooklyn, NY. A prototype is now installed on two hydrants along Cool Streets in Red Hook, Brooklyn. This minimal prototype extends the New Public Hydrants research from the most low cost and utilitarian perspective ($40 per retrofit). Next step is to fabricate a nice industrial soap mount and attach it to the bollard. Video by Theo Stewart-Stand.
JULY 23, 2020
Urban Systems Lab Joins the NYC Mayor’s Office Recovery Data Partnership
The Urban Systems Lab joins the NYC Mayors Office Recovery Data Partnership to share data with the City to aid in COVID-19 response and recovery efforts. The USL will be sharing data from our social survey, “Perception and Use of Urban Parks and Open Space During COVID-19 Social Distancing in New York City”, which explores among other things access and use of urban parks and open spaces in NYC during COVID-19. →
June 18, 2020
Extreme Heat, COVID, and Equity in NYC
The National Oceanic and Atmospheric Administration (NOAA) is forecasting an unusually warm summer in the US for 2020. In New York City, this could exacerbate heat exposure in homes, where most heat-related mortality occurs, as well as potential brownouts or blackouts due to extreme weather.
What will potential heatwaves, blackouts, and brownouts mean for city residents already struggling with lack of air conditioning and limited access to green spaces? How will existing health, weather, and economic hazards be affected by new guidelines designed to reduce COVID-19 outbreaks in NYC? What are just and equitable solutions to address threats posed by extreme heat and other interdependent risks?
The USL participated in a Cary Institute science conversation featuring Emily Nobel Maxwell, Director of The Nature Conservancy’s Cities Program in New York, Christian Braneon, a Remote Sensing Specialist at the NASA Goddard Institute for Space Studies, Annel Hernandez, Associate Director of the NYC Environmental Justice Alliance, and Timon McPhearson, Director of the Urban Systems Lab (The New School) and a Cary Institute Senior Research Fellow. Take a look at the video above to see the full presentation and click here for additional resources.
June 15, 2020
Urban Parks and Open Spaces during COVID-19

The Urban Systems Lab is analyzing data collected through a social survey on the importance of urban parks, open space, and other green spaces during the COVID-19 crisis in the United States. The aim is to understand how people are using these spaces during the pandemic and how this may affect mental and physical wellbeing.
MAY 29, 2020
New Published Research on COVID-19 and Climate
The USL Research team recently published two pieces in the journals Nature and arXiv featuring recent COVID-19 analysis. The first appears as a Letter to the Editor in arXiv, “Note on published research on the effects of COVID-19 on the environment without sufficient depth of science” discussing the complexities of linking NYC’s air quality to social distancing policies. The second is a Correspondence in the latest issue of Nature, “Heat and COVID-19 could be twin killers” authored by Timon McPhearson, Ahmed Mustafa and Luis Ortiz on the potential effects of extreme weather and heat risk during COVID.
May 14, 2020
COVID-19 and Housing Precarity

USL researchers have conducted new analyses that identifies strong relationships between housing precarity (defined as eviction rates, rent burden, and crowding) and vulnerability to Covid-19. The team looked at variables such as Forced Displacement, Rent Burden and Crowding through the lens of contextual vulnerability. To read more of their analysis click here.

Monthly eviction totals for all of New York City from Jan 2017 to April 2020.
May 4, 2020
Weekly air pollution (mean NO2) from February through April 2020
USL Researchers have noticed a notable decrease in weekly air pollution since the second week of March 2020. However, some weeks in March and April showed high NO2 level (but less than February and early weeks of March before stay-at-home orders). This indicates that we should not give full credit for the reduction in air pollution to the shutdown. Significant days of rain in March and April have made it difficult to show a significant relationship between stay-at-home orders and the cleaner air. (Data source: Sentinel-5P) Developed by Ahmed Mustafa.
April 21, 2020
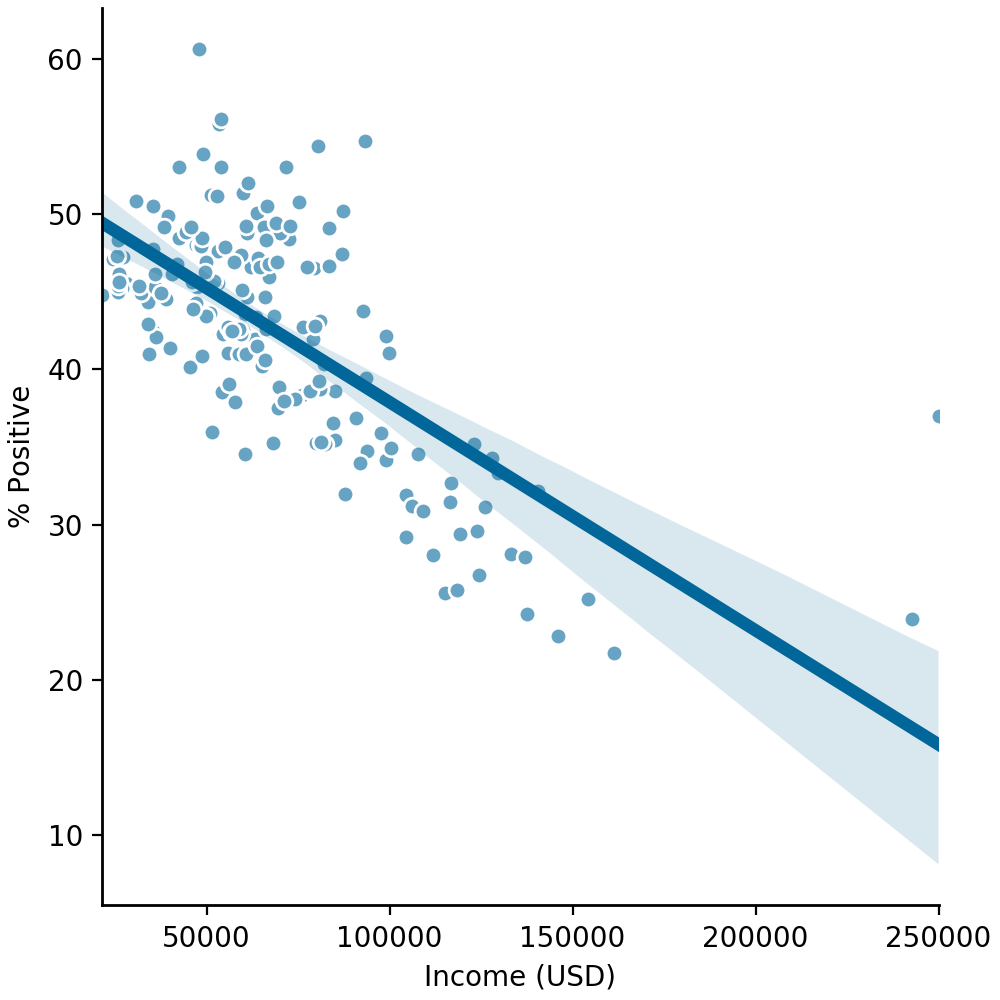
Social Vulnerability Indicators Predict Inequity in NYC COVID Cases
The Urban Systems Lab team is analyzing a range of key social vulnerability indicators against cumulative percentage of tests with a positive result per zip code in New York City. The results, shown below, highlight the class and racial inequities of the pandemic, which are impacting communities of color and frontline responders disproportionately. The data released by the NYC Department of Health, broken down by zip code, shows 34% of COVID-19 deaths were Hispanic, 28% African American and Black, 27% White, and 7% Asian. Shaded areas represent the 95% confidence intervals.
Data from the NYC Department of Health’s Github and the American Community Survey (2017).


April 20, 2020
Mobility of NYC Residents Under Social Distancing
Figures show the spatial distributions of geo-located tweets between April 1 through April 15 in NYC. The density of tweets roughly represents the population density in the city. Percentage of geo-tweets (from April 1 through April 15) per land-use which can be used to track locations of human activity during the COVID-19 crisis as it evolves. Over 60% of collected tweets were received from residential-related uses, confirming a strong impact on human behavior of shelter-in-place orders. The differences across weekdays and weekends in activities that occurred within urban green & open spaces are marginal with an average of 8.2% of tweets during weekdays VS an average of 9.1% during weekends. The figure shows that the shelter-in-place and social distancing orders appear to be observed regardless of the day, with regular patterns. Developed by Ahmed Mustafa.
Figure: Positive COVID-19 cases in New York City by Zip Code. Data from the NYC Department of Health’s Github and the American Community Survey (2017).
April 16, 2020
Availability and Access to COVID-19 Testing Kits in NYC
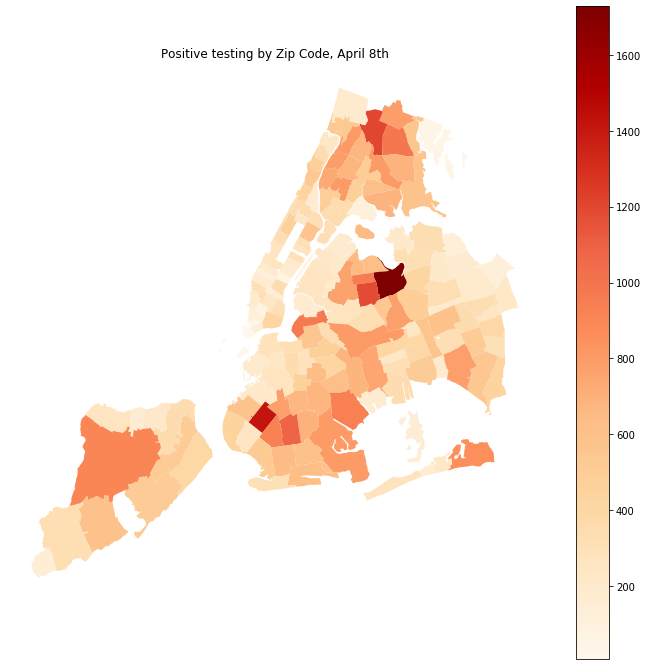

As more and more cases from COVID-19 are reported by the thousands, testing kits in New York City are still limited and hard to come by. Given that New York City is in the midst of its most challenging time in this epidemic, it is important to be able to allocate these limited tests in the most efficient and strategic manner. As of April 8th, the number of positive cases ranged from as low as 8 to as high as 1,728 per zip code. Developed by Avigail Vantu using NYC Department of Health and Mental Hygiene data. To read a full analysis and see the top 5 zip codes with the largest number of people testing positive as of April 8th. click here.
April 3, 2020
New York City Electric Load
An analysis of New York City electric load since 2015 is revealing significant reductions which are trending below a 5 year average. This decrease in energy load is important because it essentially means that NYC's energy peaks are driven in large part by office, commercial, and industrial uses. However, electric loads are higher in the summer because of air conditioning use. If we were to give everyone in the city an AC unit for instance, would that affect the total energy use significantly (considering the neighborhoods with the least AC adoption have at ~75% already)? Or would decreasing energy use in the non-residential sector offset more widespread adoption? Overall the Midcontinent Independent System Operator is reporting an 18% reduction in electric load regionally, compared to March 2019.

Figure: NYC Electric Load 2015 - Present. Electric loads in NYC have lowered since the lockdown order. Data collection and analysis performed on April 1st, 2020 (Electric load data: NYISO; Temperature Data: NOAA).
NYC Subway Use
As NYC urges residents to shelter in place and social distance, New York’s mass transit system has been impacted in different ways. According to the MTA subway ridership has hit historic lows (down 87%), and worker shortages have cut service on some lines such as the B, W, 7, J and Z. However ridership declines are not uniform across the 5 boroughs, highlighting equity, access, and socio-economic issues. In low-income neighborhoods ridership is more consistent with data from this time last year, with reports of overcrowding as service is disrupted. The USL’s analysis examines data on daily entries registered by the city's turnstiles, which can be used to track some of the behavioral changes that COVID-19 has triggered as cases escalated.


Figure: NYC Subway Use (Feb 1 - April 17, 2020). Source: MTA turnstiles traffic data and NYC Health Github
Figure: MTA Subway ridership scatterplots showing distribution based on Median income, % Below Poverty and % Uninsured.
March 2020
Social Vulnerability and COVID-19
As the world responds to the ongoing COVID-19 pandemic, a need to understand the dimensions of social vulnerability is key in both addressing the crisis long-term but to also consider other ongoing challenges related to climate change, urban development, and equity. At the Urban Systems Lab, our work has often considered who is most at risk when considering a range of ongoing hazards and threats from extreme heat and weather, to flooding and damage to vital infrastructure.
Similar to issues related to climate change, not everyone who lives in a city will experience the COVID-19 crisis in the same way. Depending on your age, race, ethnicity, income level, proximity to medical resources and key infrastructure, your experience will vary considerably. Additionally, changing behavior including social isolation, sheltering in place, may create additional vulnerabilities and challenges for the wellbeing of residents. Planning and related governance processes can be intentionally or unintentionally exclusionary in this respect, alienating minority and marginalized groups from decision-making that address the real needs of vulnerable communities.
Visualizing Who is Most Affected and Where
In prior CDC reports, data has shown that “nearly 40 percent of patients sick enough to be hospitalized were ages 20 to 54.” The fatality rate however is highest amongst those aged 85 or more, which ranges from 10% to 27%, followed by 3% to 11% among persons aged 65–84 years, 1% to 3% among persons aged 55-64 years, <1% among persons aged 20–54 years, and no fatalities among persons aged ≤19 years. In more recent data from the New York City Department Department of Health, older groups make up most of the city's hospitalizations and deaths with 42% of coronavirus patients hospitalized in New York City so far, 65 or older. About 9% of the patients in the 18-44 age group had to be hospitalized, compared to 22% of patients 45-64, 36% of patients 65-74, and half of those 75 and over. That's similar to the nationwide portion with approximately 45% of US hospitalizations the 65 or older age group.
Although New York has been characterized as the “epicenter” of the COVID-19 outbreak, new research from The Marron Institute of Urban Management, New York University describes cities like New York, LA, San Francisco and Seattle as the “vanguard” on the pandemic front. Their research looks at metropolitan areas (MSAs) as a function of its population and density, and to a lesser extent as their role as a gateway to the world. They hypothesize that metropolitan areas are reporting more infections because they tend to be the locations for the onset of infection earlier on in the spread, and because more testing is occurring per capita. They also explain many urban centers have a large share of population over 75 years of age and the share of the population living at high density.
Population density plays a key role here, especially in New York which is the largest city in the United States with about 8.5 million people in 2016, according to the U.S. Census Bureau, and the largest also in terms of economic activity (with the metropolitan area home to approximately 23.6 million people). According to the NYC Department of Planning, “New York has the highest population density of any major city in the United States, with over 27,000 people per square mile,” and accounts for over 40% of the entire population of New York State. Although population density is one important factor, there are several other issues related to equity, social vulnerability and climate that the USL is analyzing. Below are brief summaries of some of NYC’s most vulnerable communities - lease get in touch if you have data or suggestions for more analysis to include.
Figure 3. NYC Population Density. Source: American Community Survey (ACS) 2018.
Uninsured Individuals and Access to Health Care
According to the NYC Department of Health and Mental Hygiene, there were about 615,000 uninsured New Yorkers in 2017, roughly 7 percent of the city’s population (U.S. Census Bureau). Among city residents who were not U.S. citizens about 300,000, or nearly 22 percent, were uninsured—and the rate was likely even higher among noncitizens who were undocumented.
Queens Community District 7, which includes the neighborhoods of Flushing, Murray Hill, and Whitestone, had an uninsured rate of 15.5 percent in 2017, the highest in the city. Yet there are no public hospital facilities in the district. Likewise, Brooklyn Community District 7 (Sunset Park and Windsor Terrace) had an uninsured rate of 12.4 percent and no public hospital facilities in proximity. Neighborhoods, such as Queens Community Districts 3 (Jackson Heights and North Corona) and 4 (Elmhurst and South Corona), with comparatively high shares of uninsured residents as well as nearby public hospital facilities. More than 14 percent of residents in Queens Community Districts 3 and 4 were without insurance.
There also were neighborhoods with comparatively low rates of uninsured residents such as Manhattan’s Community District 3 (Chinatown and Lower East Side, 6.0 percent uninsured) and Community Districts 1 and 2 in the Bronx (Hunts Point, Longwood, and Melrose; 9.3 percent) served by a number of NYC Health + Hospitals facilities. (New York City Independent Budget Office)
Figure 4. Population in NYC Without Health Insurance. Source: American Community Survey (2017).
Communities Living Below Poverty Line
Overall the poverty rate is 17.3% (2018 data) citywide, with unemployment at 4.2% as of March 2020 (however, not reflective of recent unemployment filings). The New York City Government Poverty Threshold for 2017 was $33,562. Although trends show extreme poverty levels have decreased over the past several years, a larger share of New Yorkers — 43.1 percent — was "near poverty" in 2017.
According to the 2018 NYC Community Health Atlas, the Bronx has the highest share of communities living below the poverty line. The neighborhoods that have the highest percent of poverty based on income and necessary expenses is Fordham and University Heights (34%), Highbridge and Concourse (32%), Morrisania and Crotona (31%), Belmont and East Tremont (31%).
The CUNY Graduate School of Public Health & Health Policy (CUNY SPH) is also analyzing job loss rates in NYC. In their initial tracking survey conducted March 20-22 findings show 29% of New York City residents are reporting that either they or someone in their household has lost their job as a result of coronavirus. Job loss is also disproportionately impacting Hispanic and lower income city residents with two in five respondents (41%) saying either they or a household member lost their job in the last two weeks.
Figure 5. Population Below Poverty Line. Source: American Community Survey (ACS) 2018.
Rent Burden
The Rent Burden, which is a percentage of renter-occupied homes whose gross rent (contract rent plus average monthly cost of utilities including electricity, gas, and water and sewer) is equal to or greater than 30 percent of household income in past 12 months is 51% overall citywide. The neighborhoods of Fordham and University Heights (65%), Borough Park (64%) and Elmhurst and Corona (62%) are the neighborhoods with some of the highest rates of Rent Burden.
Figure 6. Rent Burden in NYC. A number of tenants’ rights groups including Make the Road, New York Communities for Change, and the Met Council on Housing have warned housing evictions and foreclosures could compound the danger of the virus spreading to vulnerable populations.
Energy Burden
The Energy Burden is the proportion of total household income that goes towards home energy bills, which includes electricity, natural gas, and other heating fuels. According to the American Council for an Energy Efficient Economy, for metropolitan households in the US, the median burden is 3.5%. USL Research Fellow Luis Ortiz has been conducting research on energy burden and its impact on communities in New York City, especially as climate change drives more frequent heat waves and overall temperature increases in urban centers.
As of 2017, heat waves caused the second most weather-related fatalities in the United States (National Weather Service, 2015), with 97 directly attributed deaths per year between 2008 and 2017 and 107 in 2017 alone. Studies have shown that majority of heat-related mortality occurs within homes and that the neighborhoods with highest heat-related vulnerability coincide with those with lowest air conditioning adoption (eg. low-income individuals, communities of color and low-income multifamily units). In neighborhoods with highest burden such as the South Bronx and Central Brooklyn, current burden of AC use can reach 5.7% of household income (for a 1000 sq ft/92.9 sq m home).
Figure 7. Energy Burden in NYC. Research shows that heat vulnerability and energy burden will disproportionately impact socially vulnerable communities that do not have consistent access to air conditioning.
The Elderly
In New York City there are approximately 1.4 million elderly, age 60 and older, which constitute 17% of the population, and the proportion is projected to increase to 50% of the population in the next two decades.
According to the 2018 NYC Community Health Atlas, the neighborhoods that have the highest percent of adults ages 65 and older include: Coney Island (22%), Upper East Side (20%), Rego Park and Forest Hills (19%), Riverdale and Fieldston (18%), Throgs Neck and Co-op City (18%).

Figure 8. Elderly Population over 65 in NYC. Research on COVID-19 cases show older adults may face the greatest risks to the virus because of a greater prevalence of chronic conditions and weakened immune systems.
Children and Adults with Asthma
Overall in New York City, about 10 percent of adults are asthmatic, according to the CDC. A combination of air pollution, mold, dust and asthmatic triggers like pollen and weather fluctuations affect African-American and Latino populations disproportionately. This is often a factor of proximity to large highways like the Major Deegan, the Bruckner, and the Cross Bronx expressways, industrial zones, and inadequate access to health services. According to the American Academy of Allergy Asthma & Immunology, New York City, over 39,000 children under the age of 15 visited the emergency room because of asthma in 2010.
According to a 2016 NYC Community Health Profile, the South Bronx neighborhoods of Mott Haven and Melrose had three times as many hospitalizations for asthma as the rest of New York City, and 1.5 as many as the rest of the Bronx. While 0.3 percent of children aged 5 to 14 were hospitalized for asthma in New York City in 2013, 0.7 percent were in the Bronx, and 1.2 percent in Mott Haven and Melrose. In the same year, 0.2 percent of asthmatic adults got hospitalized in New York City, 0.5 percent did in the Bronx, and 0.7 in Mott Haven and Melrose. In Hunts Point and Mott Haven in the Bronx, the asthma hospitalization rate is 12.2 per 1,000 children; in East Harlem it’s 11.4. Both are more than double the citywide rate of 5 per 1,000 children.

Figure 9. Asthma Rates for Adults in NYC. Recent studies have shown high levels of air pollution and asthma have been linked to larger numbers of people hospitalized with pneumonia. Death rates from asthma, which are also linked to pollution, are three times higher among African Americans.

Figure 10. Asthma Rates for Children in NYC.
Displaced Communities and People Experiencing Homelessness
According to the Bowery Mission, nearly one in every 125 New Yorkers is homeless. In December 2019, there were 62,590 homeless people, including 14,792 homeless families with 22,013 homeless children, sleeping each night in the New York City municipal shelter system. Families make up more than two-thirds of the homeless shelter population. (Coalition for the Homeless). Research shows that the lack of affordable housing is a driving factor, with a large majority of vulnerable populations experiencing homeless also dealing with mental and physical health issues. Approximately 57 percent of heads of household in shelters are African-American, 32 percent are Latinx, 7 percent are white, less than 1 percent are Asian-American or Native American, and 3 percent are of unknown race/ethnicity.
Health Workers and Frontline Responders
According to the Center for Health Workforce Studies, in 2014, there were nearly 20 million jobs in the US either in the health sector or in health occupations employed outside the health sector, accounting for over 13% of the total US workforce. In New York State, there were 1.2 million in the healthcare field, (13.5 percent of total employment), with 516,736 health care professionals in New York City. As of 2016, the NYC Fire Department reported 4,500 Emergency Medical Services workers.
Incarcerated Individuals
According to the NYC Comptroller and NYC Department of Corrections, there are currently 8,136 inmates in the city’s limits. In New York State, there are over 92,000 people in a federal, state or local prison. People of color are overrepresented with 53.3% African American, 33.9% Hispanic, 7.5% White, 3.7% Other and 1.6% Asian. The average age is 35.6, and women represent 6% of the total population.
According to City Limits, there are 14 prisons located throughout New York City. The Bronx is home to two current facilities, while Manhattan has five; Brooklyn has four and Queens has three. There are none in Staten Island. In recent reports from the Legal Aid Society (via Gothamist) COVID-19 has been reportedly spreading on Rikers Island. 900 incarcerated people on Rikers are over 50-years-old. About 600 have chronic medical conditions, 300 are held on a parole warrant, 200 are held on bail, and about 75 are serving a city sentence—or less than one year.
Research Highlight
Interdependent Risks of COVID-19 and Climate
How will COVID-19 and potential weather extremes interact to drive social, economic, and health impacts for vulnerable populations in New York City?
As the coronavirus continues to expand in cities like New York, fundamental questions about who will be most impacted are critical to understand for improving local and state level COVID-19 emergency responses, and resilience policy and planning. The USL is examining how potential impacts of shifting human behavior and shelter-in-place policies will interact with changing weather and potential weather-related extremes such as heat waves, flooding, or storm events that could damage critical infrastructure for COVID-19 responses. This is especially critical as current models (Ferguson et al. 2020) predict COVID-19 cases and deaths may not peak until June 2020 or later with social distancing policies in place that could last through summer 2020. These policies may shift exposure for already at-risk communities to climate and weather-related extremes and further affect demand for energy, internet access, air conditioning, food, health and other critical services.
The USL team is working to integrate social media, building infrastructure, energy demand and use, mobility and social-demographic data that leverages cutting-edge simulations, modeling, and visualizations of urban social and infrastructure systems to create novel insights into interdependent COVID-19 vulnerability and social vulnerability to extreme weather. Scroll down below to see our initial social vulnerability analysis and mapping, and stay tuned for further updates.
The Urban Systems Lab Data Visualization Platform
The USL Data Visualization Platform is an interactive web application that provides 3D visualizations of socio-ecological data meant to aid city planners, first responders, researchers, NGOs, and local community groups in envisioning strategies for creating more just and resilient urban futures.
To explore NYC data including interactive exploration of vulnerability indicators in 3D, please see the USL Data Visualization Platform. The platform was developed in part to begin understanding these COVID-19 related intersecting conditions, and to envision strategies for creating more just and resilient urban futures. We are currently working to update our map layers to provide a helpful understanding of where the most vulnerable communities are located and why. To explore and share the map visit: http://nyc.urbansystemslab.com/

Figure 11. Elderly Population over 65: 2010 Census Blocks. Recent analysis has shown that elderly people are more at risk of the effects of Coronavirus. Elderly people, like other demographics , are not spatially uniform and so some areas of the city represent hotspots of potential risk. (Note: Will update with 2018 data shortly)
Resources
The USL is compiling a list of key research, datasets, and relevant articles that may be important to stay informed of during this ongoing crisis. Keep an eye on this space for updates, send us resources to add, and let us know what else you’d like to see here.
Relevant USL Publications
Depietri, Yaella, Khila Dahal, Timon McPhearson. 2018. “Multi-hazard risk in a coastal megacity.” Natural Hazards and Earth Systems Sciences 18:3363-3381, https://doi.org/10.5194/nhess-18-3363-2018 (PDF)
Ortiz, Luis E., Jorge E. González, Radley Horton, Wuyin Lin, Wei Wu, Prathap Ramamurthy, Mark Arend, Robert D. Bornstein. 2019. “High-Resolution Projections of Extreme Heat in New York City.” International Journal of Climatology, https://doi.org/10.1002/joc.6102 (PDF)
Andersson, Erik, Johannes Langemeyer, Sara Borgström, Timon McPhearson, Dagmar Haase, Jakub Kronenberg, David N. Barton, McKenna Davis, Sandra Naumann, Lina Röschel, Francesc Baró. 2019. “Enabling Urban Green and Blue Infrastructure to Improve Contributions to Human Well-being and Equity in Urban Systems.” BioScience, https://doi.org/10.1093/biosci/biz058 (PDF)
McPhearson, Timon, & Jones, N. The Liveable City. Our Future on Earth 2020. Future Earth. (PDF)
Andersson, Erik, Sara Borgström, Timon McPhearson. 2017. “Double insurance in dealing with extremes – Ecological and social factors for making nature based solutions last,” in Nature-based Solutions to Climate Change in Urban Areas (Nadja Kabisch et al., eds), Springer (PDF)
McHale, Melissa R., Steward TA Pickett, Olga Barbosa, David N Bunn, Mary L Cadenasso, Daniel L Childers, Meredith Gartin, George Hess, David M Iwaniec, Timon McPhearson, M. Nils Peterson, Alexandria K. Poole, Louie Rivers III, Shade T Shutters, Weiqi Zhou. 2015. “The New Global Urban Realm: Complex, Connected, Diffuse, and Diverse Social-Ecological Systems.” Sustainability (Special Issue), 2015, 7, 5211-5240. doi:10.3390/su7055211 (PDF)
McPhearson, Timon. 2013. “Wicked Problems, Social-ecological Systems, and the Utility of Systems Thinking.” The Nature of Cities, http://www.thenatureofcities.com/?p=2180
Depietri, Yaella, Timon McPhearson. “Changing urban risk: 140 years of climatic hazards in New York City.” Climatic Change 148:95-108, https://doi.org/10.1007/s10584-018-2194-2 (PDF).
Depietri, Yaella, Timon McPhearson. “Integrating the grey, green, and blue in cities: Nature-based solutions for climate change adaptation and risk reduction,” in Nature-based Solutions to Climate Change in Urban Areas (Nadja Kabisch et al., eds), Springer (PDF)
Sources
Jared Anderson, Kassia Micek, and Jeff Ryser. (2020). COVID-19-related load impacts are being reported by several US grid operators. S&P Global Platts. Retrieved from https://www.spglobal.com/platts/en/market-insights/latest-news/electric-power/032320-covid-19-related-load-impacts-are-being-reported-by-several-us-grid-operators
Christina Goldbaum and Lindsey Rogers Cook. (2020). They Can’t Afford to Quarantine. So They Brave the Subway. NY Times. Retrieved from https://www.nytimes.com/2020/03/30/nyregion/coronavirus-mta-subway-riders.html
Caroline Spivack. (2020). Here’s how the coronavirus pandemic is affecting public transit. Curbed. Retrieved from https://ny.curbed.com/2020/3/24/21192454/coronavirus-nyc-transportation-subway-citi-bike-covid-19
NYC Department of Planning. (2020). “New York City Population.” Retrieved from https://www1.nyc.gov/site/planning/planning-level/nyc-population/population-facts.page
US Census Bureau. (2018). American Community Survey (ACS). Retrieved from https://www.census.gov/programs-surveys/acs
Centers for Disease Control. (2020> Severe Outcomes Among Patients with Coronavirus Disease 2019 (COVID-19) — United States, February 12–March 16, 2020. Retrieved March 18, 2020. https://www.cdc.gov/mmwr/volumes/69/wr/mm6912e2.htm?s_cid=mm6912e2_w
Naidoo M, Traore K, Culp G, King L, Lopez C, Hinterland K, Gould LH, Gwynn RC. (2018). Community Health Profiles 2018 Map Atlas. The New York City Department of Health and Mental Hygiene. Retrieved from https://www1.nyc.gov/assets/doh/downloads/pdf/data/2018-chp-atlas.pdf
Irfan, U. and Belluz, J. (2020). Vox. “Why Covid-19 is so dangerous for older adults.” Retrieved from https://www.vox.com/2020/3/12/21173783/coronavirus-death-age-covid-19-elderly-seniors
Elias, Melinda. (2018). “Are NYC Health + Hospitals Facilities Located in Community Districts With the Highest Shares of Uninsured New Yorkers?” New York City Independent Budget Office. Retrieved from https://ibo.nyc.ny.us/iboreports/h+h-facilities-uninsured.pdf
American Academy of Allergy Asthma & Immunology. (2020). “Asthma Statistics.” Retrieved from https://www.aaaai.org/about-aaaai/newsroom/asthma-statistics
New York City Department of Health and Mental Hygiene. (2018). New York City Community Health Profiles. Retrieved from https://www1.nyc.gov/site/doh/data/data-publications/profiles.page
Calma, Justine. (2020). Air pollution could make the COVID-19 pandemic worse for some people.” The Verge. Retrieved from https://www.theverge.com/2020/3/19/21186653/coronavirus-covid-19-air-pollution-vulnerable-lung-disease-pandemic
Lerner, Sharon. (2020). “2.2 Million People in the US Could Die if Coronovirus Goes Unchecked.” The Intercept. Retrieved from https://theintercept.com/2020/03/17/coronavirus-air-pollution/
Bowery Mission. (2020). “Homelessness is a Shared Experience in the New York Metro Area.” Retrieved from https://www.bowery.org/homelessness/
Coalition for the Homeless. (2020). Basic Facts About Homelessness: New York City. Retrieved from https://www.coalitionforthehomeless.org/basic-facts-about-homelessness-new-york-city/
Center for Health Workforce Studies, State University of New York. (2018). The Health Care Workforce in New York: Trends in the Supply of and Demand for Health Workers. Retrieved from http://nyachnyc.org/wp-content/uploads/2018/04/CHWS-The-HC-Workforce-in-NY-2018.pdf
New York State Comptroller. (2018). Vital Signs: Health Care Employment Gains Across New York State. https://osc.state.ny.us/reports/economic/health-care-employment-2018.pdf
NYS Department of Corrections. (2019). Information for 1st 6 months FY 2019. https://www1.nyc.gov/assets/doc/downloads/press-release/DOC_At%20a%20Glance-1st6_Months_FY2019_012919.pdf
DiPrinzio, H. (2018). The Jail Next Door: A Look at the 14 Correctional Facilities in New York’s Neighborhoods City Limits. Retrieved from https://citylimits.org/2018/07/17/the-jail-next-door-a-look-at-the-14-correctional-facilities-in-new-yorks-neighborhoods/
Pereira, S. (2020). “Inmate And Correction Officer On Rikers Island Tests Positive For Coronavirus As Calls To Release Inmates Intensify” Retrieved from https://gothamist.com/news/correction-officer-rikers-island-tests-positive-coronavirus-calls-release-inmates-intensify
Mayor’s Office for Economic Opportunity. (2019). New York City Government Poverty Measure 2017: An Annual Report from the Office of the Mayor. Retrieved from https://www1.nyc.gov/assets/opportunity/pdf/19_poverty_measure_report.pdf
Spivack, C. (2020). Curbed. “New York lawmakers move to ban evictions during the coronavirus outbreak.” Retrieved from https://ny.curbed.com/2020/3/12/21177133/nyc-tenant-eviction-moratorium-coronavirus
Ortiz, Luis E., Jorge E. González, Radley Horton, Wuyin Lin, Wei Wu, Prathap Ramamurthy, Mark Arend, Robert D. Bornstein. 2019. “High-Resolution Projections of Extreme Heat in New York City.” International Journal of Climatology, https://doi.org/10.1002/joc.6102
New York City Panel on Climate Change. (2019). New York City Panel on Climate Change 2019 Report Chapter 6: Community‐Based Assessments of Adaptation and Equity. Retrieved from https://nyaspubs.onlinelibrary.wiley.com/doi/10.1111/nyas.14009
Sonal J., Sawyer S., and Hernández, D. (2019). Energy, Poverty, and Health in Climate Change: A Comprehensive Review of an Emerging Literature. Frontiers in Public Health. https://doi.org/10.3389/fpubh.2019.00357
Dominianni C, Lane K, Johnson S, Ito K, Matte T. Health impacts of citywide and localized power outages in New York City. Environ Health Perspect. (2018) 126:067003-1–12. 10.1289/EHP2154
Acknowledgments
Zbigniew Grabowski, Pablo Herreros, Rositsa T. Ilieva, Chris Kennedy, Ahmed Mustafa, Timon McPhearson, Luis Ortiz, Claudia Tomateo, Daniel Sauter, Joseph Steele, and others on the USL Team.
This material is based upon work supported by the National Science Foundation under Grant Number (2029918). Any opinions, findings, and conclusions or recommendations expressed in this material are those of the author(s) and do not necessarily reflect the views of the National Science Foundation.